So what? Here’s why that’s important and what we can glean from the information.
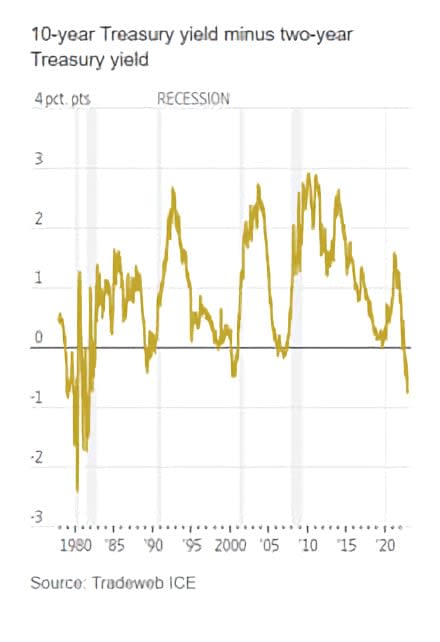
What is the Yield Curve?
“A yield curve is a line that plots yields (interest rates) of bonds having equal credit quality but differing
maturity dates. The slope of the yield curve gives an idea of future interest rate changes and economic activity.
There are three main shapes of yield curve shapes: normal (upward sloping curve), inverted (downward sloping curve), and flat.
A yield curve is used as a benchmark for other debt in the market, such as mortgage rates or bank lending rates, and it is used to predict changes in economic output and growth. The most frequently reported yield curve compares the three-month, two-year, five-year, 10-year, and 30-year U.S. Treasury debt.
Yield curve rates are usually available at the Treasury's interest rate websites by 6:00 p.m. ET each trading day.”
What Does it Mean When It’s Inverted?
Continuing with Investopedia, here’s what it signifies when the yield curve is inverted:
“A normal yield curve is one in which longer maturity bonds have a higher yield compared to shorter-term bonds due to the risks associated with time. An
inverted yield curve is one in which the shorter-term yields are higher than the longer-term yields, which can be a sign of an upcoming recession. In a flat or humped yield curve, the shorter- and longer-term yields are very close to each other, which is also a predictor of an economic transition.”
According to the Investopedia explanation, then, the current state of the yield curve – historically inverted – could indicate an upcoming recession.
I think that we’re already in a bit of a recession, though, even with mixed signals across the economic spectrum. You see, when investors invest, the general thinking is that the longer your money is invested, the higher the risk is for you and, thus, the higher the returns should be. When the yield curve inverts, though, it’s generally thought to be an indicator that investors believe there’s a change on the horizon.
Given this, I think the current yield-curve situation actually indicates that we’re further along than the data suggests and that the worst may nearly be over.
Recent updates from Fed Chair Jerome Powell tend to support my thinking: that the rate of interest-rate increases meant to slow inflation will be reduced from the highs that we’ve seen over the last several quarters.
“Because the Fed has raised rates rapidly and it takes time for those moves to influence the economy, it would make sense for officials to slow rate increases, he said at an event at the Brookings Institution. “The time for moderating the pace of rate increases may come as soon as the December meeting,” he said.
This news sent the markets soaring for the November close.
How Can You Use Yield-Curve Information?
When the yield curve initially inverts, it’s historically a signal that there’s a downside trend in the works for the markets. Now, though, and in my opinion, I think the historic low, followed by Powell’s assessment of the state of inflation and other economic indicators, means that the time is right to find great opportunities in the market.
So, look for correlative behaviors but remember, as I always say, everything comes back, but it comes back differently.
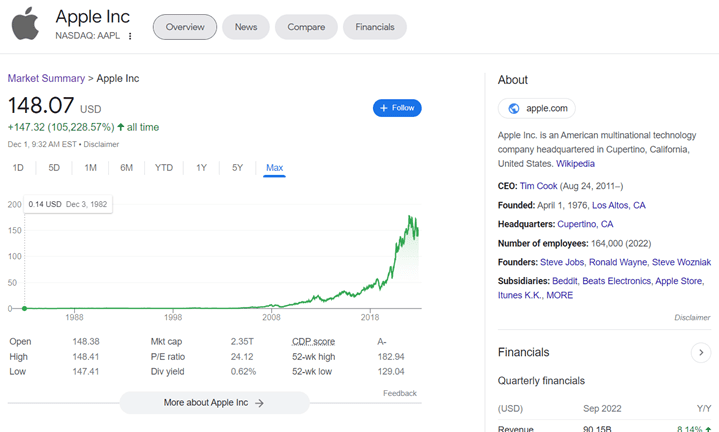
Given this, I recommend studying what’s happened during and just after previous yield-curve inversions as a starting point. Then, for good opportunities, I’d look for those companies that have either come through similar previous economic conditions with strength (an example is Apple) or, in the cases in which their histories may not be that long, look for those companies that otherwise have all the value indicators that we’ve talked about before: tangible products and services, strong and visionary leadership, sensible and logical valuations.
Snapshot, Apple Inc., from Google Finance, Dec. 1, 2022
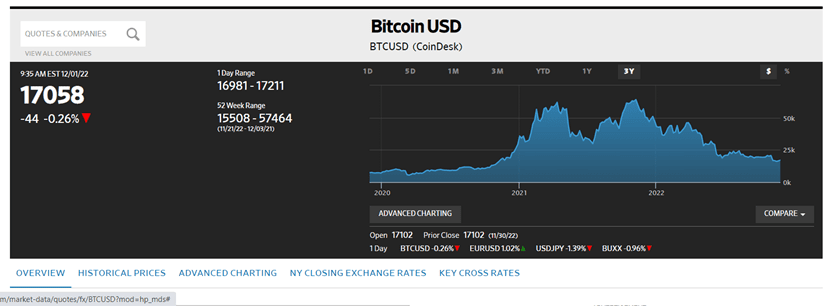
What I caution against are those “buy the dip” opportunities that have nothing going for them, like crypto, or companies that only swelled in value because everything grew over the last handful of years. For example, despite the disasters across the board over the last year or so, I can guarantee that there are tons of people out there who will jump at the chance to try and make a quick buck by buying crypto, believing (possibly correctly) that it isn’t going away.
However, I don’t see how it can come back without a slew of regulations in place, which will make it an entirely different investment vehicle and possibly one that’s less appealing to those with the quick-buck mentality. And that would be a good thing.
The Wall Street Journal, Dec. 1, 2022
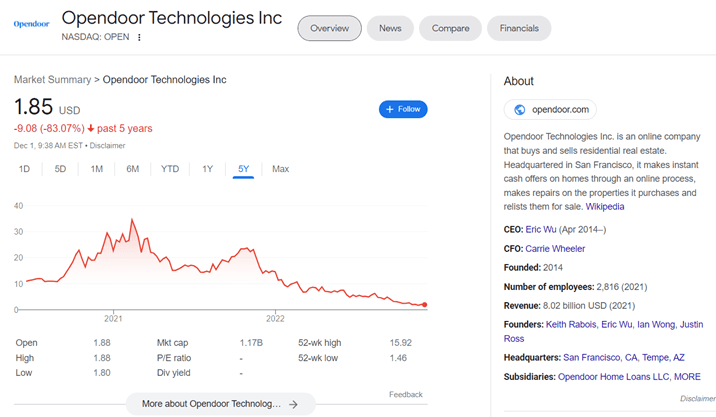
Another area that I’d watch out for is companies built on “ibuying” strategies, especially residential real estate. In some ways, this was a necessary pivot in response to the pandemic, but it went too far, too fast, and investors and home buyers alike got burned.
From Google Finance, Dec. 1, 2022
But what about other companies that have struggled lately, including several tech giants? Here, I think we need to reimagine how we look at them. To me, the best tech companies are about strong leadership, sound management, and ongoing creativity. The most successful have also been the steadfast market disruptors, and not necessarily the noisiest players.
Overall, companies with their own yield-curve inversions that generally correlate to the markets can be worth exploring; however, those that have dropped in value by more than, say, 30% are questionable (and those that have dropped in value by 70-80% should be out of the question).
Here’s what to look for: What are they built on? Who’s at the helm? Where are the opportunities for them to regain financial and market strength? Are they looking to rebuild market share in the same ways as the past (recent past, aka, pandemic times, or otherwise, this should be a red flag, as we know things won’t be the same again) or are they innovating now? Where and how are they building efficiencies into their operations? What are the target outcomes and their plans to achieve them?
These are the kinds of questions to ask. When you find companies with solid answers, then you may also find some worthwhile opportunities.